Fixing High Disk Usage and Unexpected MariaDB Kills with innodb_buffer_pool_size
My client has a few Wordpress websites and they ran into a strange issue. The stack is quite simple, just Wordpress and MariaDB both running in Docker, on Google Cloud.
When it happens, the server doesn’t respond, timing out. The VM is inaccessible, cannot SSH to the VM. We checked the log of both Wordpress and MariaDB, but couldn’t find anything useful to identify the issue. There was only normal logs, and then timing out.
They used to get attacked/DDoS, so we suspected that. But looking at the metrics at that moment, it didn’t make sense. There was no huge burst of external connection to the VM, so there was no attack, at least on application layer (we route the whole site through Cloudflare for DDoS protection).
The metrics looked fine, for the most parts:
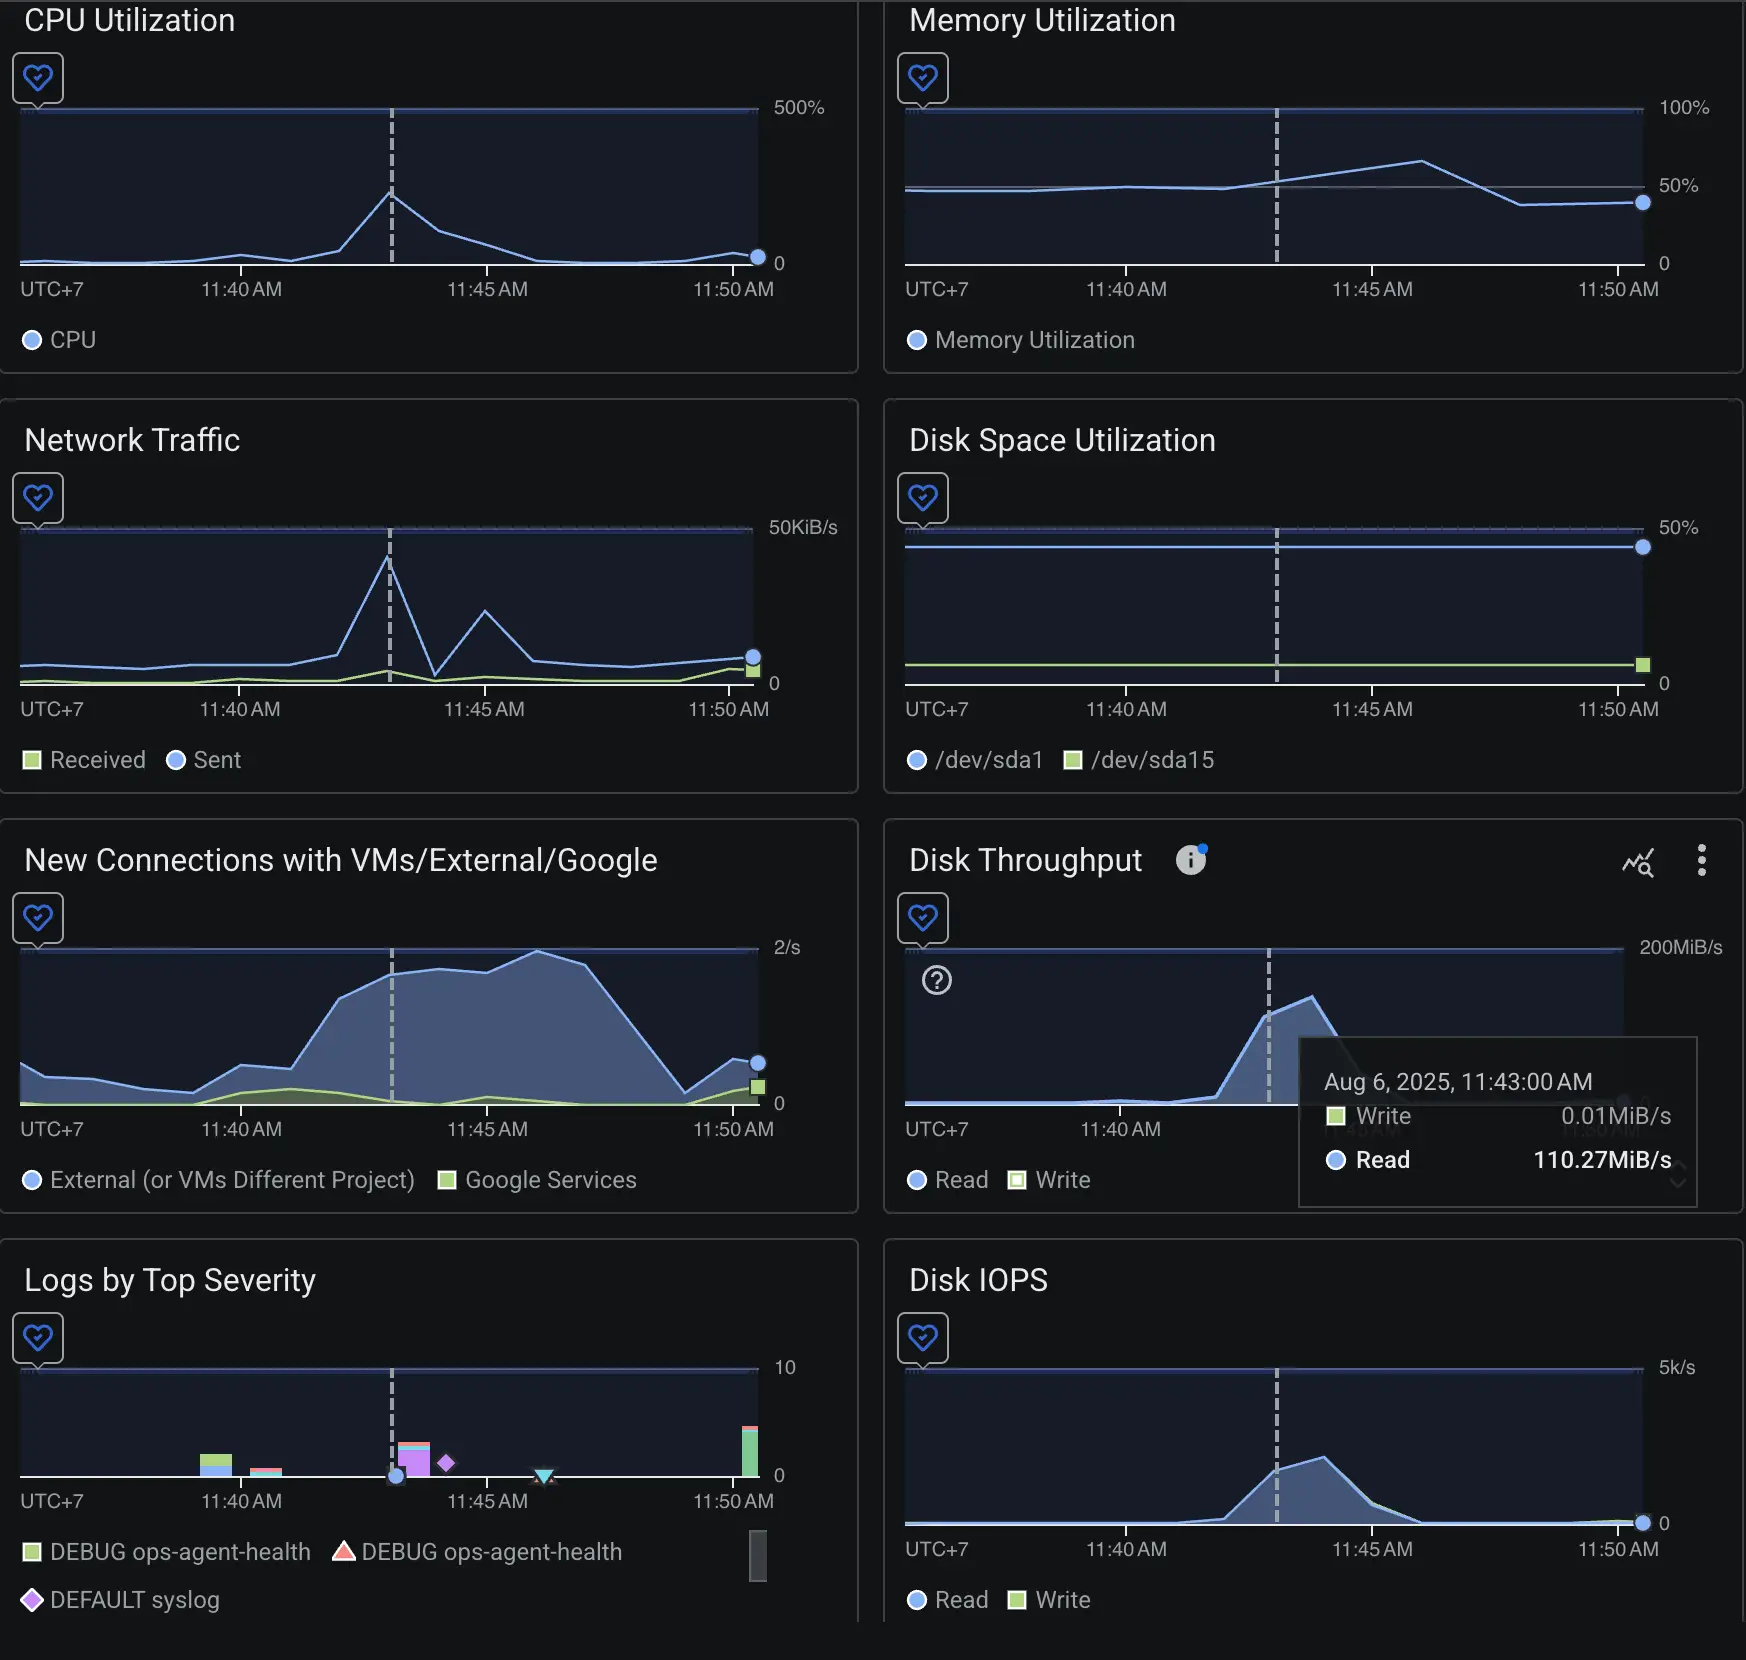
Just a burst of CPU, then it returned to normal
RAM is not full, only ~50% utilization
Sudden huge burst of Disk Throughput
We didn’t really understand the root cause, and it only happens a few times over a month, so we kinda “ignore” it.
A few days ago was the final straw, I jumped in to debug it for hours. Turned out it was a simple root cause and a simple fix as well.
Understanding the Cause
We checked the container logs, the metrics and all, but we forgot a very important part: the syslog.
kernel: [ 8085.099452] mariadbd invoked oom-killer: gfp_mask=0x140cca(GFP_HIGHUSER_MOVABLE|__GFP_COMP), order=0, oom_score_adj=0
kernel: [ 8085.099486] CPU: 1 PID: 10069 Comm: mariadbd Not tainted 6.8.0-1033-gcp #35~22.04.1-Ubuntu
kernel: [ 8085.099491] Hardware name: Google Google Compute Engine/Google Compute Engine, BIOS Google 05/07/2025
kernel: [ 8085.099497] Call Trace:
kernel: [ 8085.099503] <TASK>
kernel: [ 8085.099521] dump_stack_lvl+0x76/0xa0
kernel: [ 8085.099631] dump_stack+0x10/0x20
kernel: [ 8085.099635] dump_header+0x47/0x200
kernel: [ 8085.099691] oom_kill_process+0x116/0x270
There it was! mariadbd was killed by the kernel via oom-killer, meaning it ran out of memory. But didn’t the metrics said the memory utilization was only 50%? Then why it ran out of memory?
What is the OOM Killer?
The OOM Killer (Out-of-Memory Killer) is part of the Linux kernel that prevents the system from freezing when memory runs out. When a process requests more memory than the system can provide, either because physical + swap memory is exhausted or because a large contiguous block can’t be found due to fragmentation, the OOM Killer steps in. It selects processes to terminate based on an internal scoring system, often targeting those with the largest memory usage relative to their priority. In this case, MariaDB’s sudden large allocation request made it the top candidate, so mariadbd was killed instantly.
The Problem: A Tiny Buffer Pool
Quick check:
MariaDB [(none)]> SHOW GLOBAL VARIABLES LIKE 'innodb_buffer_pool_size';
+-------------------------+-----------+
| Variable_name           | Value     |
+-------------------------+-----------+
| innodb_buffer_pool_size | 134217728 |
+-------------------------+-----------+
1 row in set (0.004 sec)
Only 128MiB for innodb_buffer_pool_size! This is too small for a Wordpress site with moderate load.
The buffer pool is where MariaDB caches table data and indexes. When undersized, the database must fetch more data from slow disk storage, which increases latency and causes large memory bursts when loading data.
On top of that, MariaDB also allocates per-connection buffers (for sorting, joins, and temporary tables) which can multiply RAM usage during concurrent queries. Combined with a tiny buffer pool and possible memory fragmentation, these bursts were enough to trigger the OOM Killer, explaining both the spike in disk throughput and the abrupt crash.
The Fix
I have 2GB RAM for the VM so I allocate:
Set the
innodb_buffer_pool_sizeto 50% of the RAM.Limit 75% RAM for MariaDB via Docker. This means, even if the DB somehow messes it up, it will not crash the VM.
mariadb:
  image: mariadb:11.4
  ...
  deploy:
    resources:
      limits:
        memory: 1.5G
  command:
    - "--innodb_buffer_pool_size=1G"
The Result
After restarting the stack with the new settings:
Disk throughput dropped sharply.
Page loads became noticeably faster, which is a big win for optimization that I didn’t plan for!
No more unexpected process kills.
Takeaway
Check the app logs, metrics, but don’t forget to check for the syslog if your system is having an issue.
Optimize your DB config.